A Comparative Predictive Modeling Study of Weather Impact on Bike Share Trip Volume
Project Overview
Welcome! Ever wondered how much the weather actually changes our decision to bike around the city? This project dives into that question by looking at Toronto’s bikeshare data and matching it with real-time weather conditions. From warm sunny afternoons to chilly, windy mornings, the goal is to understand how things like temperature, humidity, and wind speed influence when people choose to ride.
Using data from April to September 2024, we combine hourly trip records from Bike Share Toronto with weather data from the OpenWeather API. Then, with the help of both traditional statistics and machine learning models, we predict ridership and highlight the weather factors that matter most. Whether you’re a city planner, a data enthusiast, or just someone who bikes to class, these insights can help shape smarter transportation systems for the future
You can download the full PDF report here for more detailed methods, figures, and statistical output.
Key Insights
- Hour of day and temperature were the most influential predictors of bikeshare usage, with strong peaks during commuting hours and a rapid rise in trips up to around 20°C.
- Adverse weather conditions such as rain and thunderstorms were associated with sharp declines in ridership.
- Random Forest and XGBoost achieved the highest predictive accuracy, outperforming linear models and effectively capturing complex patterns in the data.
Results at a Glance
Predicted vs. Actual Bike Trips
Figure 1. Comparison of predicted and actual bike trip counts from the test set using the best-performing model (Random Forest Cross-Validation Tuned). Each point represents an observation, with color indicating the absolute prediction error. Points near the dashed diagonal indicate accurate predictions, while deviations highlight under-estimation or over-estimation.
Feature Importance of Random Forest
Figure 2. Relative importance of predictors in the Random Forest model, based on % increase in MSE. “Hour of day” is the most influential variable, followed by temperature and humidity, with weather-related factors such as wind speed and cloudiness contributing less but still relevant predictive value.
Feature Importance of XGBoost
Figure 3. Feature contributions in the XGBoost model based on gain. The hour of day stood out as the strongest predictor by far, followed by temperature. The other features had only minor impact, showing that the model relied heavily on time of day to make accurate predictions.
Non-Linear Effect of Temperature
Figure 4. Estimated nonlinear effect of temperature on bike trip volume. Trip counts increase steadily with temperature until around 20°C, after which the effect levels off, indicating that warmer temperatures beyond this point have little additional impact on ridership.
Non-Linear Effect of Wind Speed
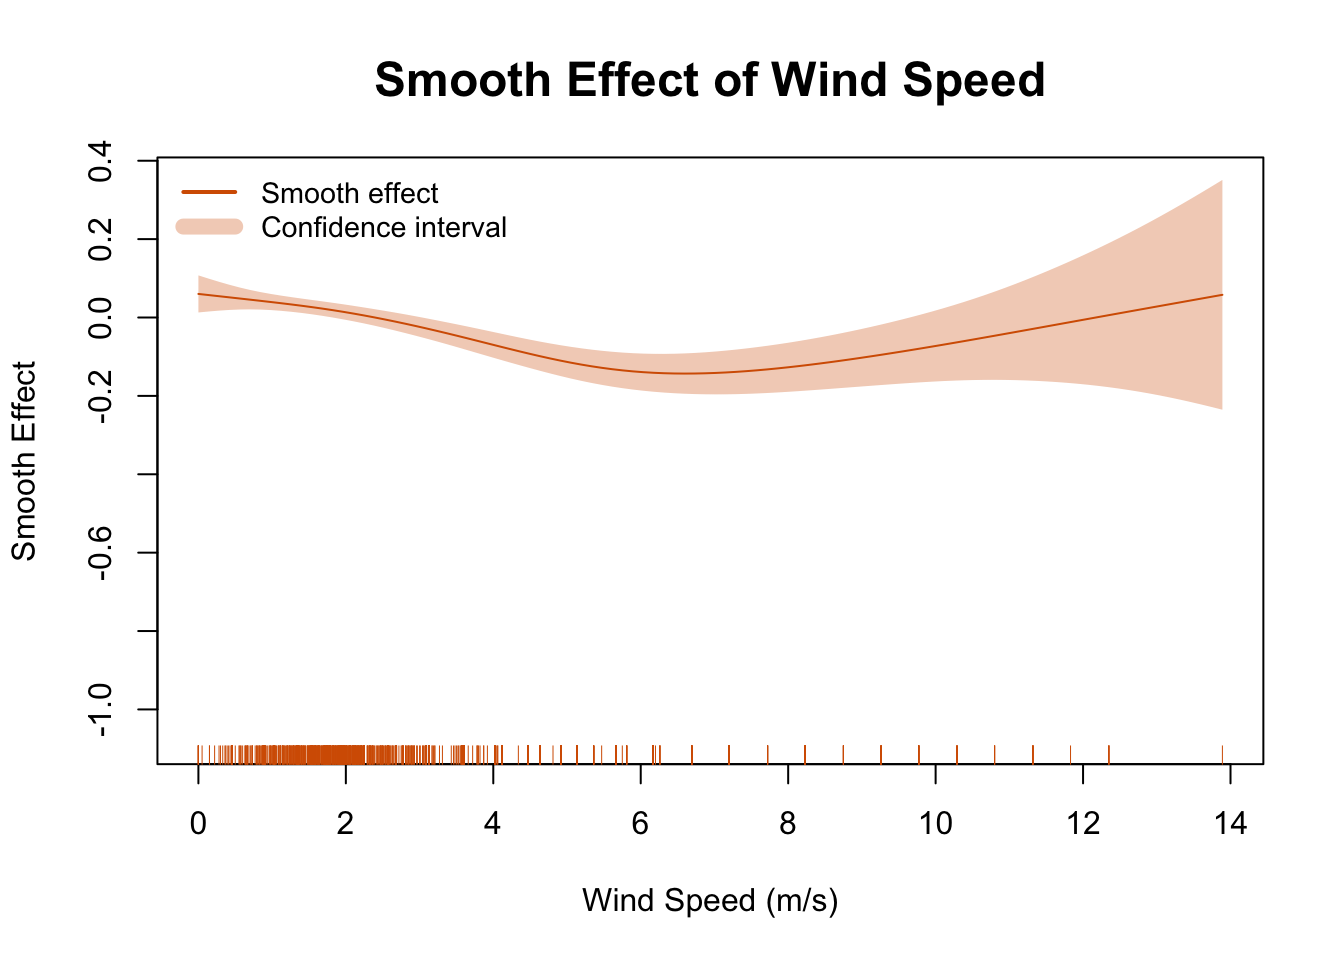
Figure 5. Estimated smooth relationship between wind speed and bike trip volume. Moderate wind speeds are linked to a drop in bike usage, though the impact is relatively small compared to other factors.
Explore More
- About outlines the data sources, cleaning steps, and modeling methodology used in this study.
- EDA explores seasonal patterns, weather trends, and how different variables relate to Bike Share usage.
- ML describes how the models were built, tuned, and compared, and presents the results of each method.
- Appendices provides detailed feature definitions, full regression outputs, and the hyperparameter grids used during model tuning.